Overview dashboard card
The Everything Presence Grid overview card lets you add a live sensor view directly to any Home Assistant dashboard. It shows the calibrated grid map and/or the sidebar sensor readings for one device, and updates in real time. Any household user — not just admins — can see a dashboard that includes this card.
Beta
The overview card is a new, beta feature. Its options and layout may change in a future release.
What the card shows
- Map — the top-down room grid with your zones, overlays, and furniture in place, and live target markers as the sensor tracks movement. The grid is read-only; editing zones and overlays is done through the panel.
- Sensors — the presence sensors, zone occupancy, and environmental readings (temperature, humidity, illuminance, CO2) from the live stream. Sensor values that the device is not reporting are hidden automatically.
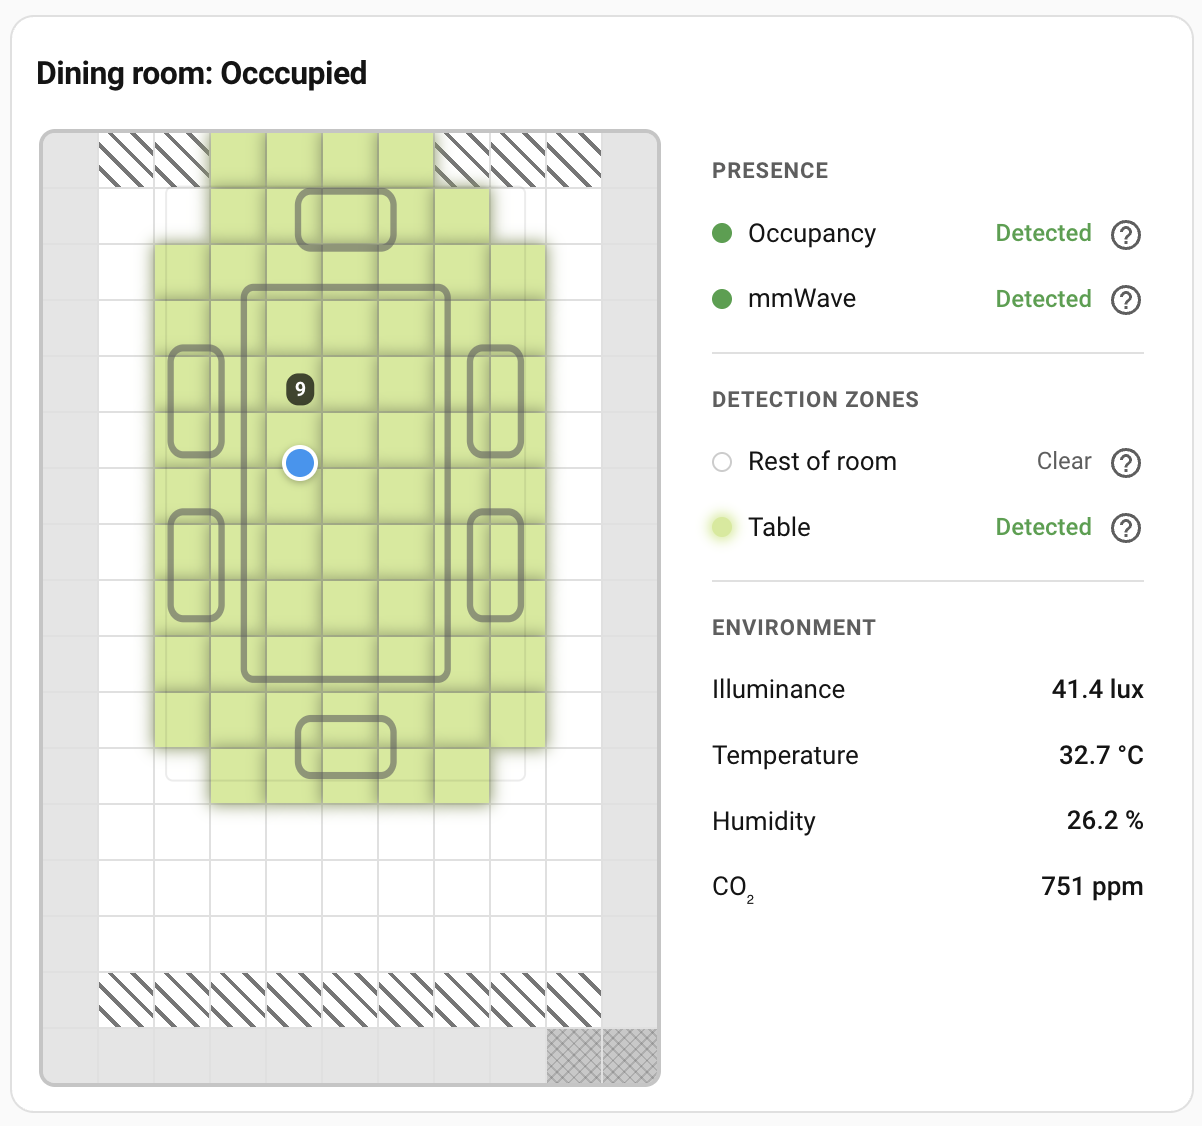
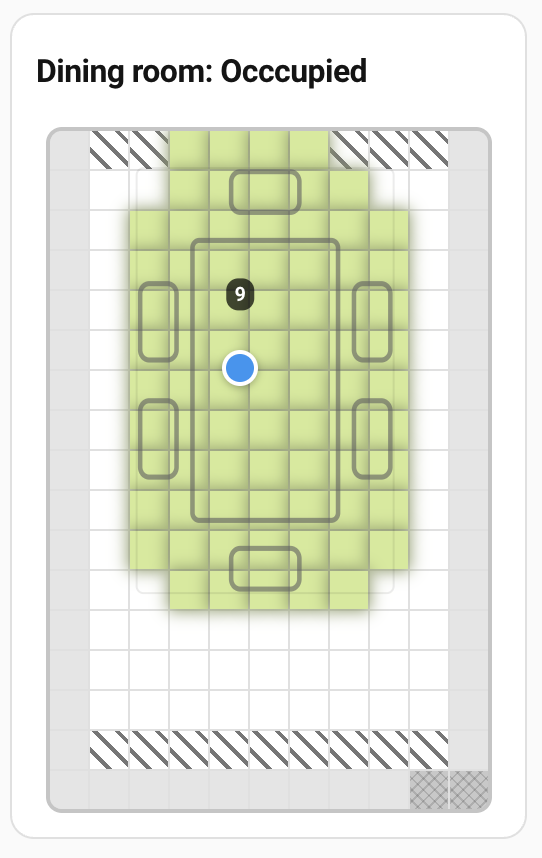
You can show the map only, the sensors only, or both together. Cards you add from the dashboard start as map only — switch on Show sensors to add the sidebar.
Adding the card
- Edit the dashboard and choose Add card.
- Search for Everything Presence Grid in the card picker. The card appears under Custom: Everything Presence Grid.
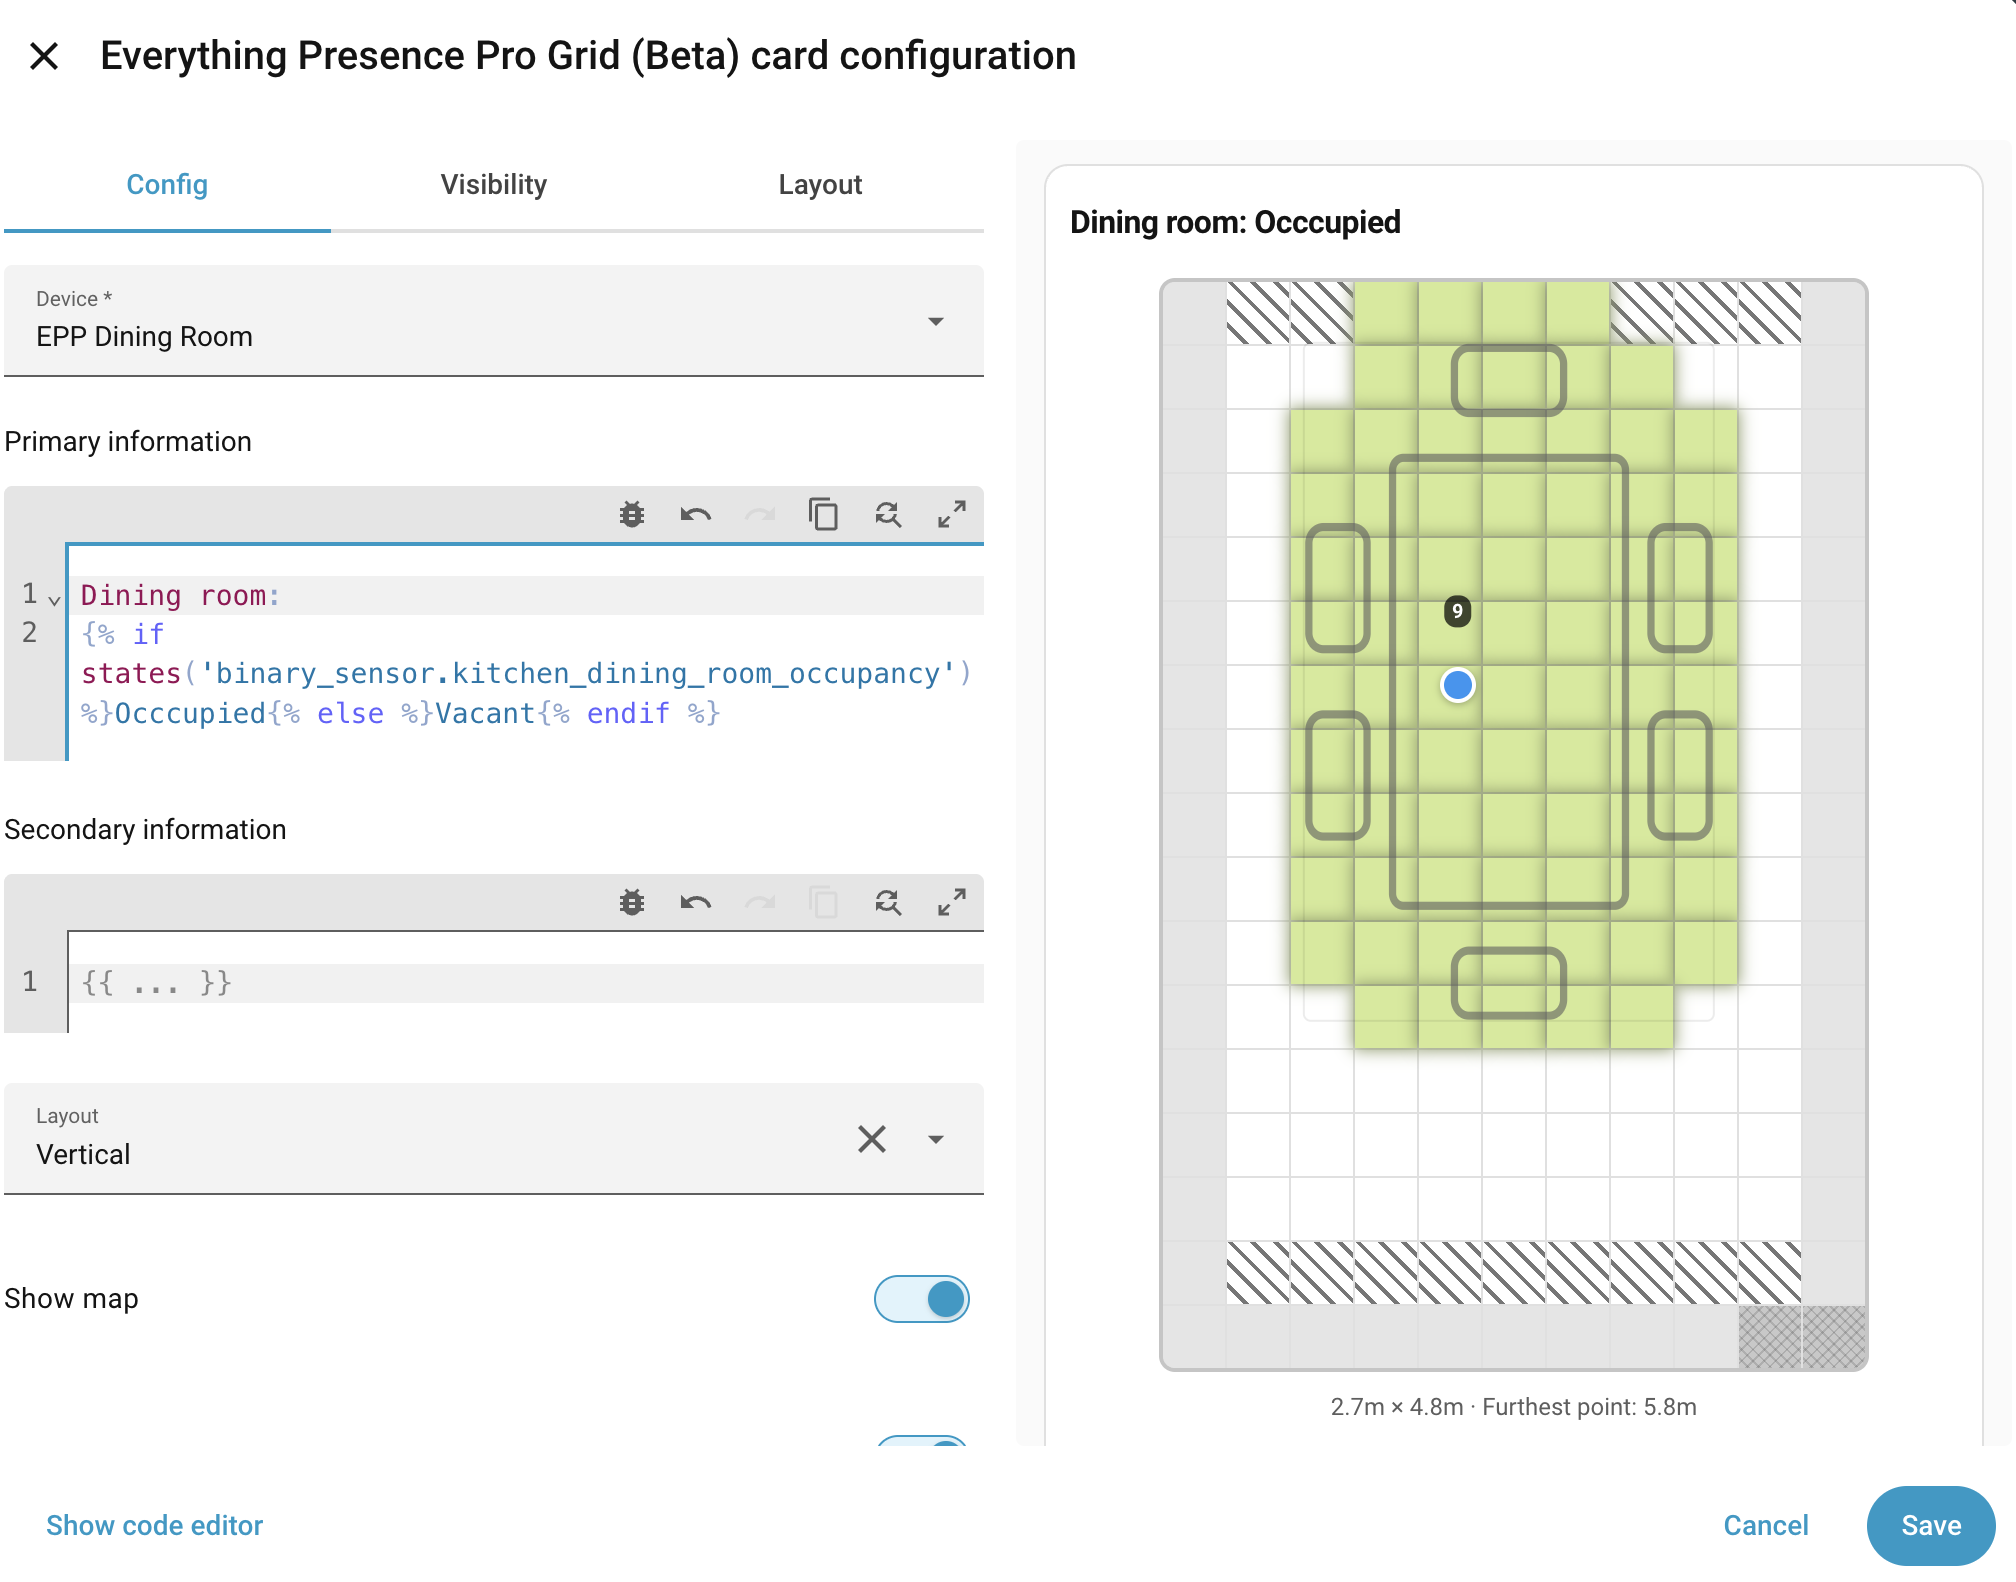
- Pick the device from the Device dropdown. The dropdown lists all Everything Presence Grid devices with an active HA registry entry.
- Adjust the options below and click Save.
On Home Assistant 2026.6 and newer, the card is offered as a suggestion in the card picker when you select an entity that belongs to an Everything Presence Grid device.
Options
| Option | Default | Description |
|---|---|---|
| Device | (required) | Which Everything Presence Grid device to display. |
| Primary | (empty) | Heading text shown above the map/sensors. Supports Jinja templates — e.g. {{ states('sensor.lounge_temperature') }}°C. Plain text is shown as-is. |
| Secondary | (empty) | Smaller subtitle shown below the Primary line. Also supports Jinja templates. |
| Show map | on | Show the live grid map. |
| Show sensors | off | Show the sensor and zone sidebar. Cards added from the dashboard start map-only; existing cards, and hand-written YAML that omits show_sensors, keep the sidebar. |
| Layout | Vertical | When both map and sensors are shown: Horizontal places the sensors alongside the map; Vertical stacks them. On narrow screens the card switches to vertical regardless of this setting. |
Sensors
Expand Sensors in the editor to control which sensor groups appear in the sidebar.
| Option | Default | Description |
|---|---|---|
| Presence | (expandable) | Toggle Occupancy, Static presence, Motion presence, Target presence, and mmWave individually. All five are on by default. |
| Zones | on | Show per-zone occupancy indicators. |
| Environmental | (expandable) | Toggle Temperature, Humidity, Illuminance, and CO2 individually. All four are on by default. Sensors with no current value are hidden automatically. |
Map layers
| Option | Default | Description |
|---|---|---|
| Show furniture | on | Overlay furniture icons on the grid. |
| Show overlays | on | Show Entry/Exit, Interference, and Suppress cell markings. |
| Heatmap | Off | Show the activity heatmap and live movement trails on the map. Choose Off, On, Toggle on card (adds a small switch on the map so viewers can show or hide the heatmap themselves, remembered per device), or Toggle and clear on card (adds the same switch, plus a Clear button — see below). Requires firmware that supports the heatmap. |
Choosing Toggle and clear on card adds a small delete-sweep button next to the heatmap switch. Any dashboard viewer can use it to wipe the device's accumulated heatmap — it asks for confirmation first, since clearing can't be undone. See Heatmap → Clearing the heatmap.
Templated text
The Primary and Secondary fields are rendered with Home Assistant's Jinja template engine, so they can show live values from any entity:
type: custom:eppgrid-card
device_id: <your-device-id>
primary: "Lounge · {{ states('sensor.lounge_temperature') }}°C"
secondary: "{{ states('sensor.lounge_targets') }} present"
Templates render in the viewing user's context and update live, so this works on
shared dashboards for non-admin users. The configured card is available to
templates as config (e.g. config.device_id).
Two cards per device
If you want a wider map view on one card and the sensor readings on another, add two cards pointing at the same device — one with Show sensors off and one with Show map off. Both cards share a single live connection to the device, so you don't pay twice for the stream.
Non-admin access
The overview card uses read-only commands that do not require admin rights. Household users without admin access can view a dashboard containing this card without being able to change any device settings.
YAML-mode dashboards
If your dashboard is in YAML mode (managed through configuration.yaml rather
than the UI), you need to add the card resource manually:
Replace <hash> with the content hash shown in Settings → Dashboards →
Resources for the Everything Presence Grid card entry — or just copy the URL
from there. The integration registers the resource automatically on UI-mode
dashboards; this step is only needed in YAML mode.
The card YAML for a typical two-pane layout:
type: custom:eppgrid-card
device_id: <your-device-id>
show_map: true
show_sensors: true
layout: horizontal
Troubleshooting
| Symptom | Likely cause | Fix |
|---|---|---|
| Card doesn't appear in the picker | The card resource isn't registered | Go to Settings → Dashboards → Resources and check that an eppgrid-card.js entry is listed. If it's missing, reload the Everything Presence Grid integration. |
| Device dropdown is empty in the editor | No devices have been set up | Complete the setup wizard for at least one device first. |
| Map shows "Room not yet calibrated" | The device hasn't been calibrated | Run the calibration wizard from the panel. See Calibration. |
| Card shows "Device offline" | The device is unreachable | Check that the device is powered and on the network. The map will restore automatically when the device reconnects. |
Still stuck? See Troubleshooting for how to open an issue.
Where to next
- Live overview → — full-panel live view with detection events and the zone editor.
- Automations → — use the presence and zone entities in automations.